
Mastering the art of crypto chart analysis is crucial for navigating the volatile world of cryptocurrency markets. This comprehensive guide will equip you with the knowledge to interpret cryptocurrency charts, identify market trends, and make informed investment decisions. Learn how to decipher candlestick patterns, understand technical indicators like moving averages and RSI, and ultimately, improve your ability to predict price movements and potentially maximize your crypto profits. Whether you’re a seasoned trader or a beginner looking to understand crypto trading strategies, this guide provides a solid foundation for successful cryptocurrency investing.
Understanding Candlestick Patterns
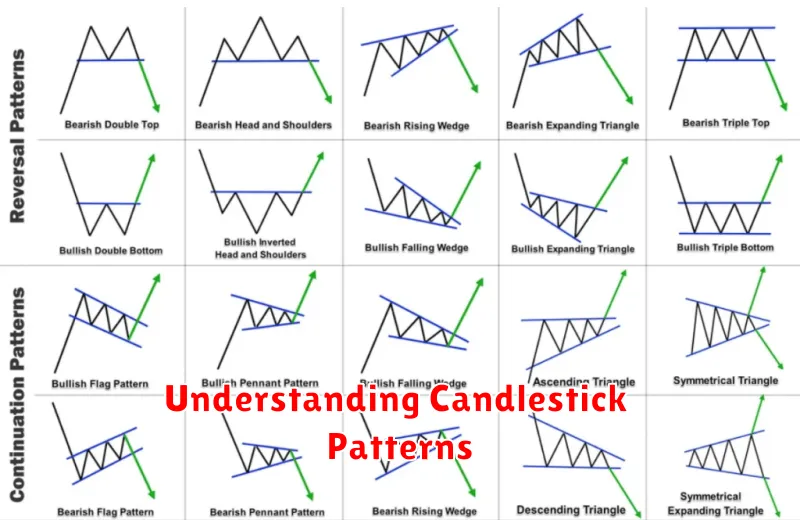
Candlestick patterns are powerful tools for interpreting price action in crypto markets. Each candlestick represents a specific timeframe (e.g., 1 hour, 1 day), showing the open, high, low, and close prices.
A bullish candlestick (green or white) indicates the closing price was higher than the opening price, suggesting upward momentum. Conversely, a bearish candlestick (red or black) shows the closing price was lower than the opening price, suggesting downward pressure.
Key patterns to recognize include: Hammer (bullish reversal), Hanging Man (bearish reversal), Doji (indecision), Engulfing patterns (reversal or continuation), and Shooting Stars (bearish reversal). Understanding these patterns helps identify potential trend reversals and continuation signals.
It’s crucial to remember that candlestick patterns are most effective when used in conjunction with other technical indicators and analysis. Never rely solely on candlestick patterns for trading decisions. Context within the broader market trend is key to accurate interpretation.
By studying candlestick patterns, traders can gain valuable insights into market sentiment and potential price movements, aiding in making more informed trading decisions. Consistent practice and experience are crucial for mastering their interpretation.
Moving Averages: How to Identify Trends
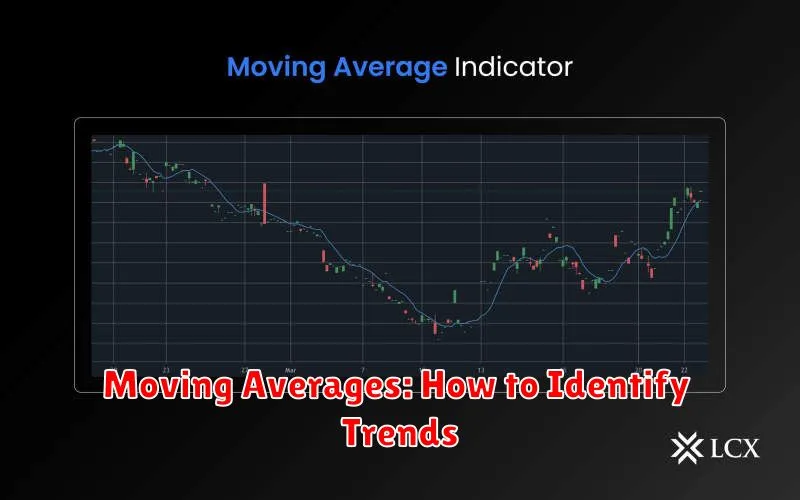
Moving averages are crucial tools for identifying trends in crypto markets. They smooth out price fluctuations, revealing the underlying direction. Simple Moving Averages (SMAs) calculate the average price over a specified period (e.g., 50-day SMA, 200-day SMA), while Exponential Moving Averages (EMAs) give more weight to recent prices, making them more responsive to changes.
Interpreting trends involves observing the relationship between different moving averages. A shorter-term SMA crossing above a longer-term SMA (e.g., 50-day SMA crossing above the 200-day SMA) is often considered a bullish signal, suggesting an upward trend. Conversely, a shorter-term SMA crossing below a longer-term SMA is a bearish signal, hinting at a downward trend.
The slope of the moving average also provides insights. A steeply rising SMA indicates a strong uptrend, while a steadily declining SMA suggests a downtrend. It’s important to note that moving averages are lagging indicators; they react to past price movements, not predicting future ones. Combining moving averages with other technical indicators provides a more comprehensive analysis.
RSI and MACD Indicators Explained
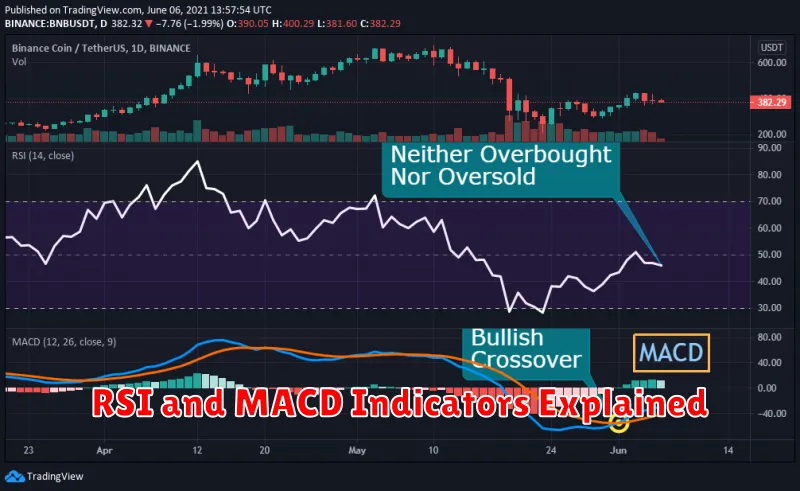
Technical indicators like the Relative Strength Index (RSI) and the Moving Average Convergence Divergence (MACD) are valuable tools for analyzing cryptocurrency charts and predicting potential market trends. They help traders identify overbought and oversold conditions, as well as potential trend reversals.
The RSI is a momentum oscillator that measures the magnitude of recent price changes to evaluate overbought or oversold conditions. Values above 70 generally suggest an overbought market, indicating a potential price correction, while values below 30 often signify an oversold market, hinting at a possible price rebound. However, it’s crucial to remember that these levels are not absolute buy/sell signals.
The MACD is a trend-following momentum indicator that shows the relationship between two moving averages of a security’s price. It consists of a MACD line (the difference between two exponential moving averages) and a signal line (a moving average of the MACD line). Crossovers between these lines can signal potential trend changes. A bullish crossover (MACD line crossing above the signal line) suggests a potential uptrend, while a bearish crossover (MACD line crossing below the signal line) might indicate a downtrend. Divergence between the MACD and the price chart can also be a significant indicator of potential trend reversals.
It’s important to note that these indicators should be used in conjunction with other forms of analysis, such as price action and chart patterns, for a more comprehensive understanding of market dynamics. No single indicator can reliably predict the future with certainty.
The Role of Volume in Crypto Trading
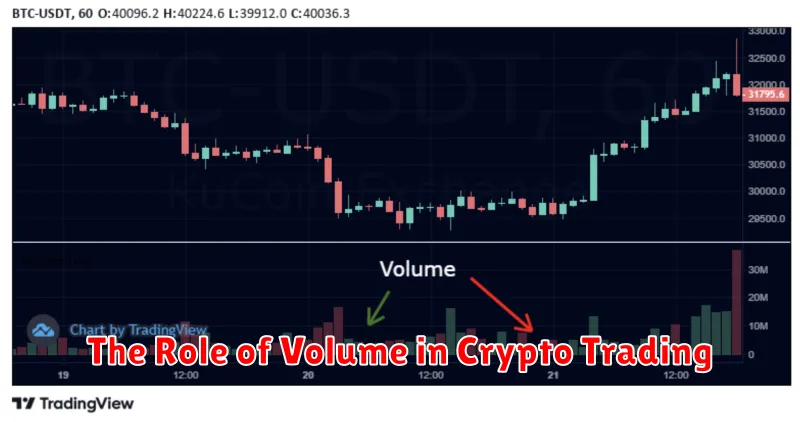
Volume in crypto trading represents the total number of units of a cryptocurrency traded within a specific timeframe (e.g., hourly, daily). It’s a crucial indicator that, when analyzed alongside price action, provides valuable insights into market sentiment and the strength of price movements.
High volume accompanying a price increase suggests strong buying pressure and a potential continuation of the uptrend. Conversely, high volume during a price decline indicates significant selling pressure, hinting at a potentially stronger downtrend. Low volume during price movements, regardless of direction, often signifies weak conviction and potential for price reversals.
Analyzing volume in conjunction with price patterns (like breakouts or consolidations) helps traders confirm the validity of price movements. For example, a significant price breakout with high volume provides a stronger signal than one with low volume.
Traders use various volume indicators, such as the On-Balance Volume (OBV) or Chaikin Money Flow (CMF), to further enhance their analysis and identify potential divergence between price and volume, which can be a precursor to trend changes.
In summary, understanding and interpreting volume is essential for discerning the strength and sustainability of price trends in the volatile cryptocurrency market. It adds a crucial layer of context to price analysis, helping traders make more informed decisions.
How to Spot Breakout and Reversal Patterns
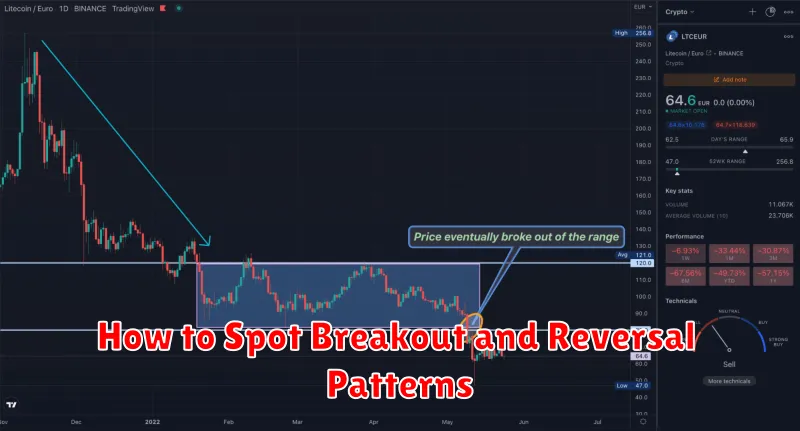
Identifying breakout and reversal patterns is crucial for predicting market trends in crypto. Breakouts signal a significant price move beyond a period of consolidation, often preceded by a triangle, rectangle, or wedge pattern. A breakout above resistance suggests a bullish trend, while a breakout below support indicates a bearish one. Volume confirmation is key; high volume during the breakout strengthens the signal.
Reversal patterns, conversely, indicate a potential change in the prevailing trend. Common reversal patterns include head and shoulders (indicating a bearish reversal), inverse head and shoulders (bullish reversal), and double tops/bottoms. These patterns often form at significant price levels (support or resistance) and are accompanied by changes in momentum and volume.
Volume plays a critical role in confirming these patterns. High volume during a breakout strengthens the signal, while declining volume can weaken it. Similarly, a significant decrease in volume during a reversal pattern can suggest a lack of conviction and might indicate a false signal. Combining volume analysis with chart pattern recognition significantly enhances prediction accuracy.
Remember that pattern recognition is just one tool in technical analysis. It should be used in conjunction with other indicators and careful risk management to make informed trading decisions. No pattern guarantees future price movement; these patterns provide probabilities, not certainties.